Evolving Workforce Requires Visionary Leadership
January 23, 2020
Police investigating shots fired at Stovall Street area in Houma
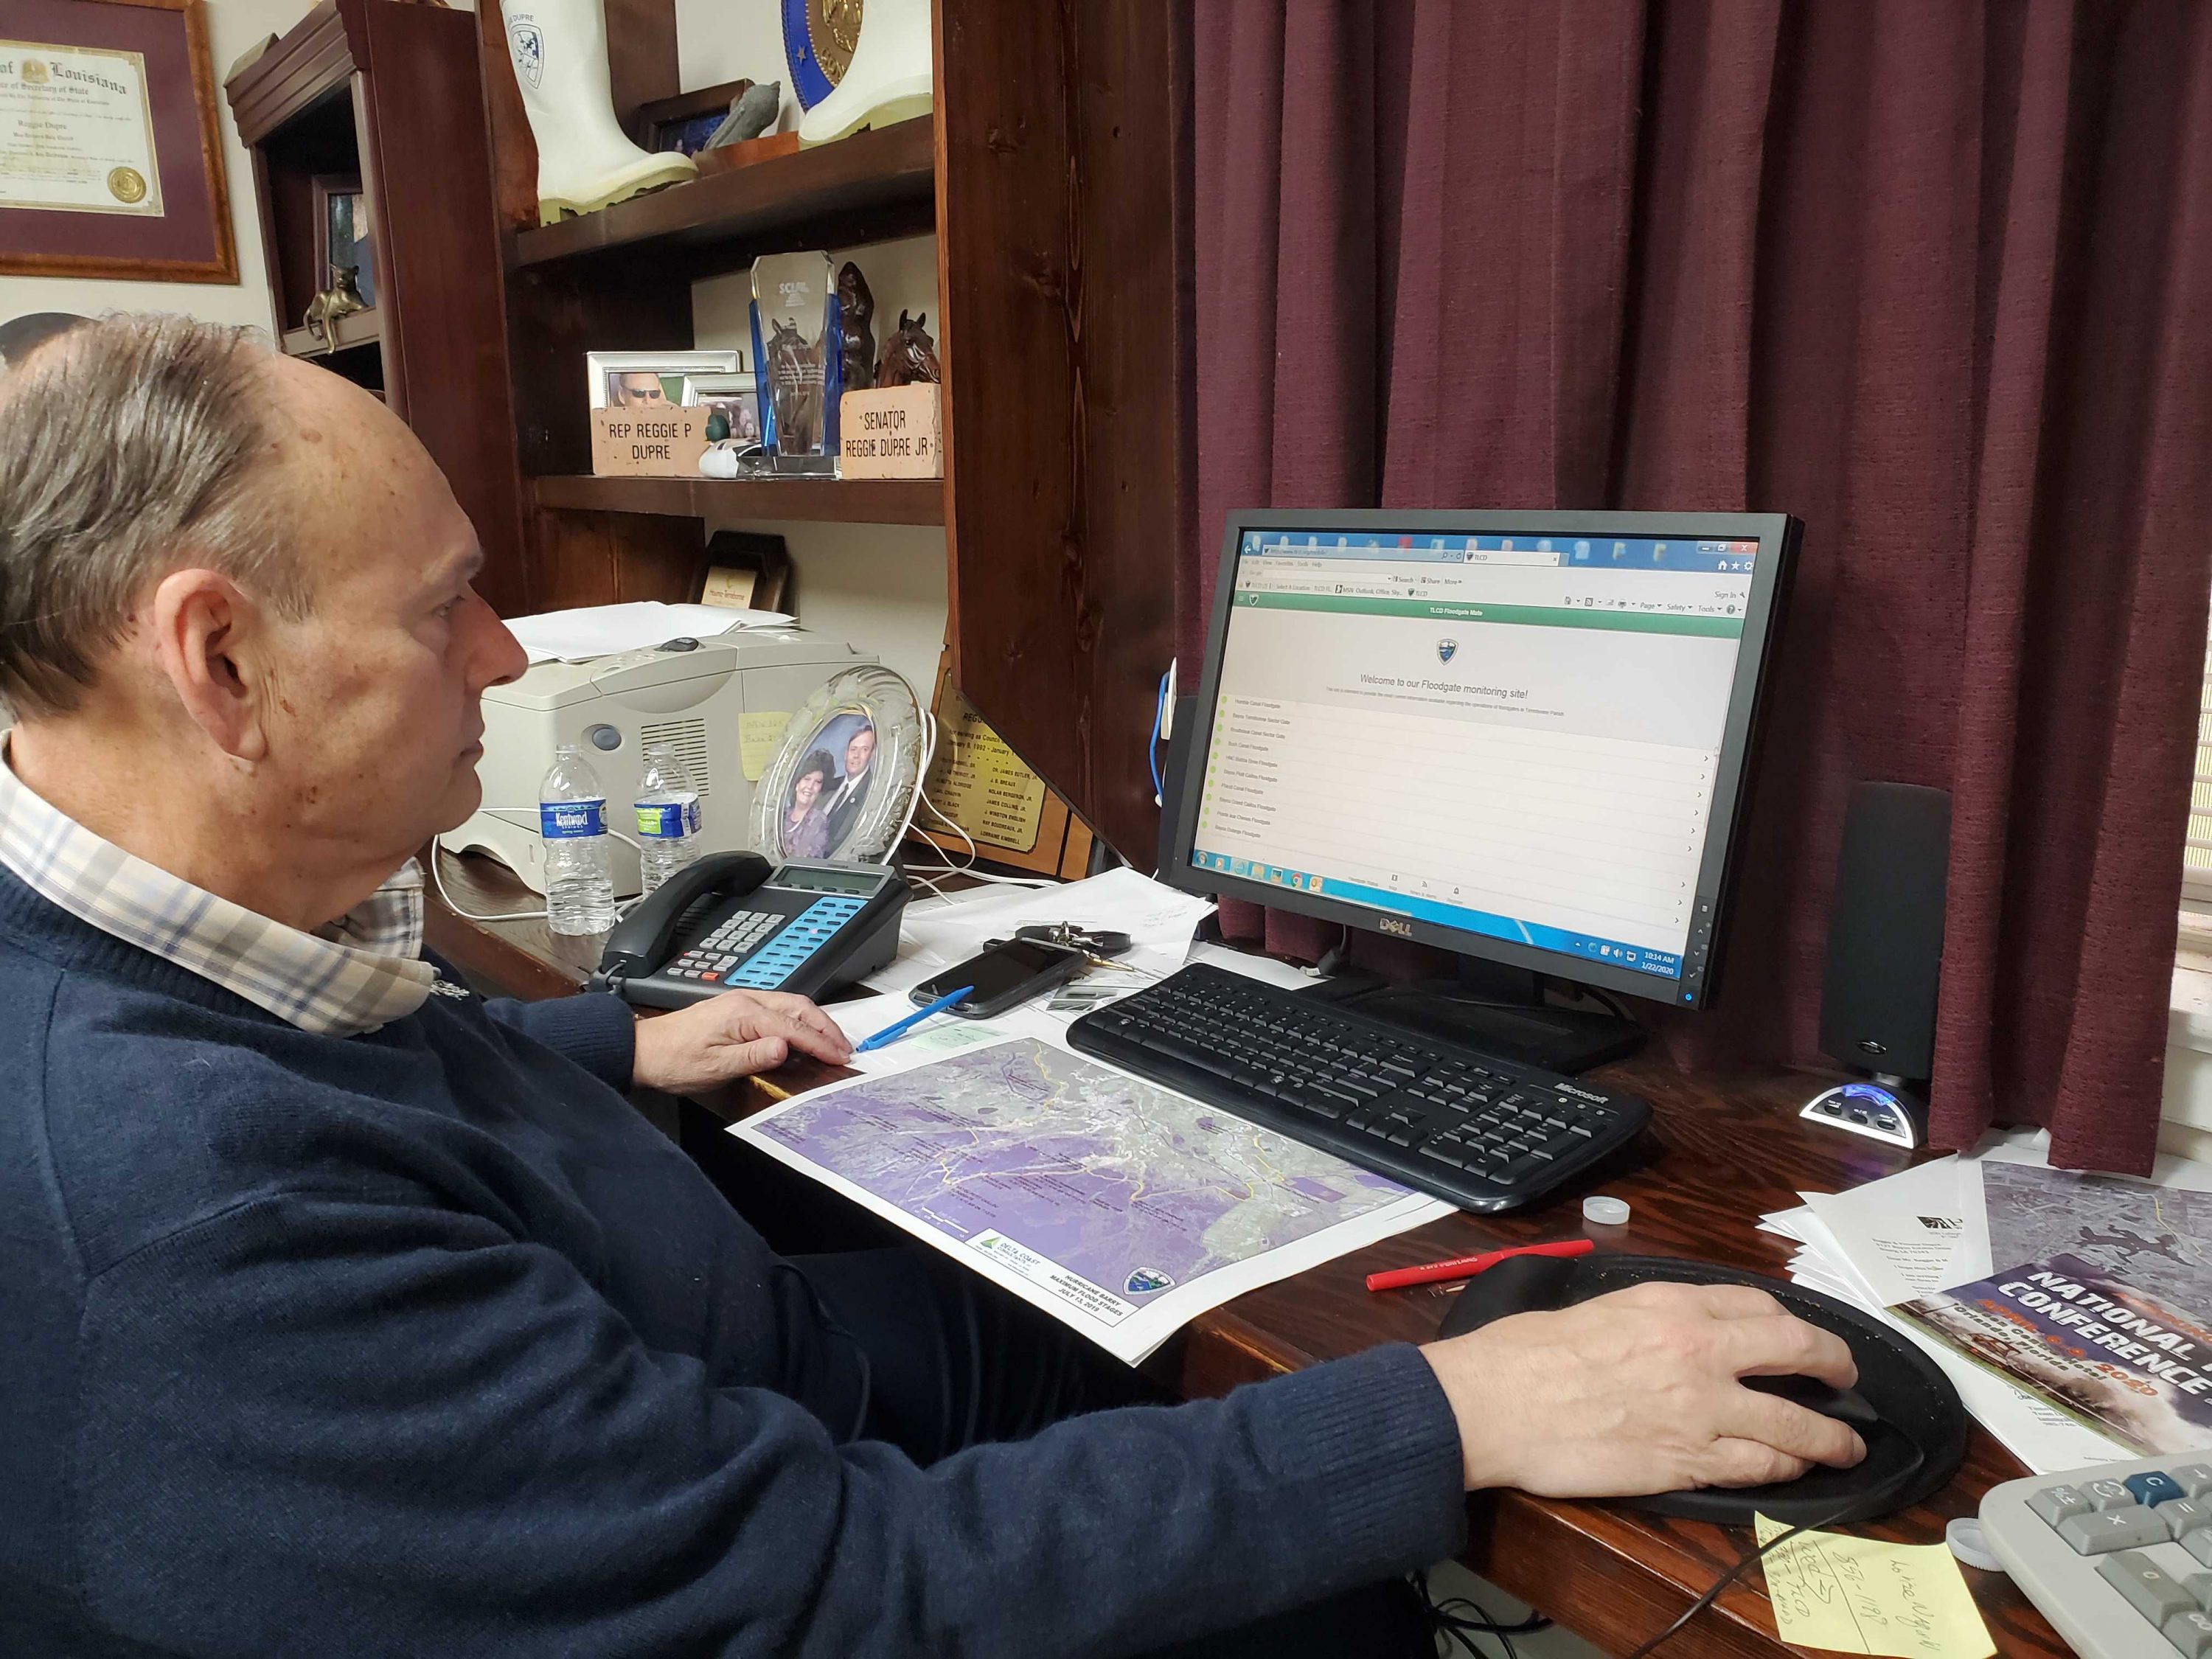
January 23, 2020Terrebonne Parish officials have a new tool for combatting flooding, and they are sharing it with the public. 10 of the 13 navigable floodgates now have data gathering electronic equipment on them.
This hardware feeds information directly to the Terrebonne Parish Levee District’s website allowing them to document and predict potential flood risks. These readings also give officials hard evidence which can be used to seek funding for projects like the Morganza to the Gulf Hurricane Protection Project.
“We’ve always known, a tidal surge is not a tsunami that hits you in 15-20 minutes and run for your lives,” said Reggie Dupre, Executive Director of the Terrebonne Parish Levee and Conservation District, turning from line graphs on his computer. “It’s usually a progression that hits one side of the parish and then the other.”
Dupre turned his chair back to the graph and pointed at it, “and that proves it,” he said with emphasis on “that.”
To most, the unassuming line-graph which Dupre was enthusiastic about, may not seem impressive. It revealed how high tide levels got at their peak during Hurricane Barry. During this storm, the data was key to responding to Montegut.
“The fact that right at 4 a.m., we were able to get on the computer and see that we had over 9ft of water behind Montegut allowed us to send resources immediately, and why we were able to save the community of Montegut. That’s the gamechanger.”
The highest surge during Barry was at Humble Canal, a 9.08′, at 4:10 a.m. For comparison, Bayou Terrebonne was 8.35′ at 4:10 a.m. and Pointe Aux Chenes was 7.70′ at 5:30 a.m.
The data viewed can be broken up into current, 24 hour, and 7 days. Velocity, wind direction, wind speed, temperature, barometric pressure, humidity can currently able to be viewed, and they may add a salinity gauge in the future.
At about $15,000 a gate to install the hardware, it makes a difference. Dupre said this, “allows us to plan with limited resources. You can plan your attacks, you can plan your maintenance of your levees.”
The District also offers some of this data to the public here. The 13 navigable canals are listed, plus two road gates. On the webpage people will see a dot, on the left, next to each gate. The color corresponds to the status of the gate: green is open, yellow is closing, and red is shut.
Those interested can sign up to receive notifications on the status of the floodgates texted or emailed to them. A user can also click on a floodgate which has an arrow on the right side of the page to view the data being collected. This data can include the flood side’s tide level, wind direction, and wind speed (wind direction and wind speed are not installed on all).
Because of the wealth of information the equipment is able to collect, Dupre said he hoped for interest from researchers.
“I would welcome academia,” he said. “I personally think somebody should document these surges and add our data.”


